

A flawless score on an automotive dependability survey won't protect you if the study treats an unresponsive infotainment screen with the same weight as a blown transmission. When you cross-reference different platforms, consulting a typical used car reliability report often creates more confusion than clarity.
You've likely noticed that glowing brand-level rankings rarely tell the whole story about an individual vehicle. One consumer index crowns a badge as exceptionally reliable, while mechanic forums document severe transmission or powertrain failures on that specific model year. Sifting through contradictory ratings makes it difficult to separate minor cosmetic nuisances from budget-breaking mechanical defects.
True due diligence requires evaluating component failure severity rather than broad customer satisfaction scores. You'll learn how to dissect automotive reliability data, separate minor software glitches from systemic mechanical flaws, and spot recurring defect patterns before committing your money.
We'll examine the structural differences between major industry reporting methodologies, highlight critical failure patterns across targeted model years, and outline an objective evaluation framework to guide your purchase decision.
Key Takeaways
- Learn how to read a used car reliability report by isolating catastrophic powertrain defects from superficial software glitches.
- Classify reported vehicle issues into distinct severity tiers to assess true financial and operational ownership risks accurately.
- Identify the methodological strengths and blind spots between self-reported owner surveys and commercial repair shop telemetry.
- Apply a structured five-step evaluation framework to audit any specific model year before signing purchase contracts.
- Use multi-source data synthesis and algorithmic scoring to eliminate blind spots across competing vehicle options.
Decoding Used Car Reliability Reports: What the Data Actually Measures
An empirical used car reliability report tracks component failure frequencies and repair severity across specific mileage thresholds to project long-term ownership risks. It does not measure how much drivers enjoy their vehicles. Conflating initial quality with long-term dependability creates immediate blind spots for shoppers.
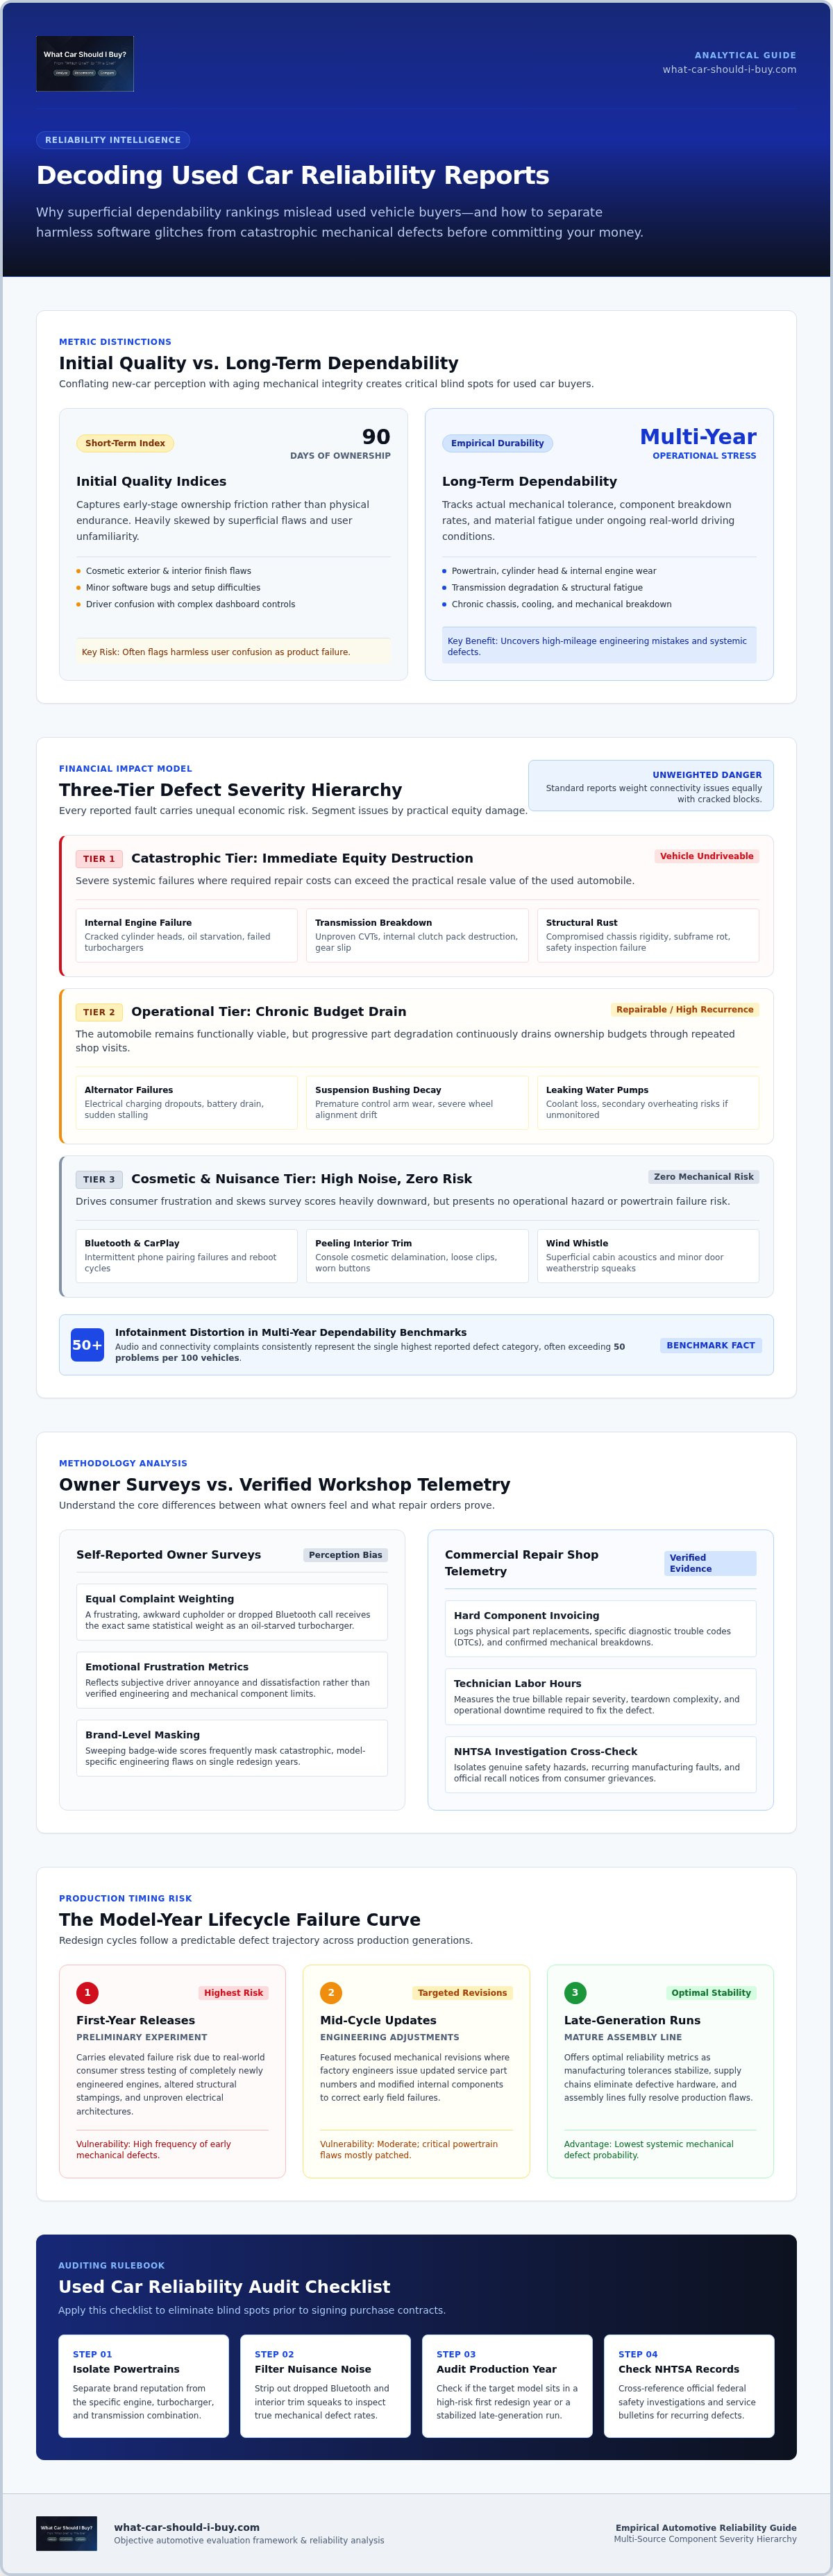
Initial quality indices capture defects during the first 90 days of ownership, often recording cosmetic flaws, software bugs, or user confusion with dashboard controls. Long-term dependability studies observe mechanical wear, powertrain longevity, and structural fatigue over multiple years of operational stress. Confusing the two metrics leads buyers to purchase vehicles built with chronic mechanical vulnerabilities.
Brand-wide reputations frequently disguise catastrophic single-year engineering mistakes. A manufacturer recognized for overall durability can easily deploy an unproven continuously variable transmission or redesigned direct-injection engine that fails prematurely. While state and federal lemon laws protect original purchasers facing recurring, unfixable defects, secondary buyers inherit those latent risks directly out of pocket. Relying entirely on sweeping badge ratings ignores the mechanical variations between specific vehicle generations.
Survey Data Versus Empirical Workshop Repair Records
Self-reported owner surveys capture perception rather than verified mechanics. Participants regularly file identical complaint weights for an awkward cupholder and an oil-starved turbocharger. These responses reflect frustration rather than pure mechanical failure rates.
Technician-verified repair orders tell a different story. Commercial repair invoice databases document hard component replacements, labor hours, and component failure codes. Analyzing verified repair claims separates actual systemic defects from subjective consumer grievances.
The Model-Year Lifecycle: Why First-Year Vehicles Risk Higher Defects
Redesign cycles follow a predictable failure curve across automotive production runs:
- First-year releases: Carry elevated risk due to real-world stress testing of completely new engines, structural changes, and untested electrical architectures.
- Mid-cycle updates: Feature targeted mechanical adjustments where factories issue revised service parts to correct early field failures.
- Late-generation runs: Offer optimal reliability metrics, as manufacturing tolerances stabilize and assembly lines resolve persistent production flaws.
Auditing a model-specific used car reliability report reveals where a target vehicle sits on this lifecycle curve, keeping you from purchasing an automaker's preliminary engineering experiment.
Core Fault Categories: Separating Nuisance Flaws from Critical Failures
Every defect carries a different financial risk. A reliable evaluation separates cosmetic nuisances from catastrophic mechanical failures. Without this distinction, minor electronics drag down dependable vehicles, while dangerous mechanical flaws remain hidden.
Objective evaluation relies on a three-tier severity hierarchy:
- Catastrophic tier: Internal engine failure, transmission breakdown, and structural rust. These issues leave the vehicle undriveable and require repairs that exceed practical equity thresholds.
- Operational tier: Alternator failures, suspension bushing decay, and leaking water pumps. The car remains repairable, but chronic degradation drains ownership budgets.
- Cosmetic and nuisance tier: Bluetooth disconnections, peeling interior trim, and wind whistle. These flaws cause frustration, but they present zero mechanical risk.
Infotainment glitches frequently distort automotive quality indices. In modern multi-year dependability benchmarks, audio and connectivity complaints consistently account for the single highest defect category, often exceeding 50 problems per 100 vehicles. Connectivity dropouts in Apple CarPlay or Android Auto alone generate thousands of logged grievances. An unweighted used car reliability report treats a dropped phone connection the same as a cracked cylinder head. Buyers must cross-reference official safety investigations via the NHTSA recall and safety defect database to isolate genuine hazards from superficial electronics complaints.
Systemic component failures cascade quickly. A worn timing guide sheds plastic into the oil pan, starves the top end, and destroys the camshafts within weeks. If you want to verify component longevity before scheduling test drives, reviewing a comprehensive digital Analysis Report provides weighted mechanical risk profiles that filter out high-liability models.
Powertrain and Drivetrain Mechanical Breakdown Profiles
Engine assessments must prioritize timing chain tensioners, turbocharger oil seals, and head gasket integrity. Transmission analysis requires equal scrutiny. Continuously variable transmissions often suffer belt slippage and pulley scoring past 80,000 miles, while dual-clutch units exhibit dry-clutch shudder in stop-and-go driving. All-wheel-drive transfer cases and viscous couplings frequently develop fluid leaks that cause internal bearing lockup if ignored.
Chassis, Suspension, and High-Voltage Electrical Systems
Chassis components require systematic inspection. Electronic steering racks develop expensive motor failures, while adaptive dampers leak fluid well before conventional shocks. Control arm ball joints degrade rapidly under modern vehicle curb weights. In hybrid and electric options, evaluate high-voltage battery cell balance, DC-DC converter stability, and onboard charging hardware. Corroded body control module wiring harnesses can trigger phantom electrical drains that cost thousands to trace.
Comparing Reliability Reporting Methodologies: Strengths and Blind Spots
No single used car reliability report tells the full truth in isolation. Every automotive study operates on specific collection parameters, demographic filters, and mathematical models. Understanding these underlying methodologies keeps you from misinterpreting the final scores.
Major reporting frameworks present distinct operational trade-offs:
- Three-year initial ownership benchmarks: Measure original owners over an initial 36-month operational window. While these studies accurately highlight factory assembly defects, their primary limitation lies in duration. Data collection abruptly terminates right as factory warranties expire.
- Subscription-based long-term registries: Leverage voluntary questionnaires spanning vehicle fleets over decades. These platforms apply weighted formulas to penalize major powertrain breakdowns over minor cabin trim rattles, yet they rely on self-selected subscriber demographics.
- Commercial repair claim indexes: Track verified telemetry and closed repair invoices across independent service facilities. They document real-world replacement parts expenditures, labor hours, and unscheduled mechanical repairs without subjective driver impressions.
Statistical frameworks often create distortions. Light vehicles on U.S. roads average roughly 12.8 years according to S&P Global Mobility benchmarks. Relying solely on short-term indices reveals virtually nothing about how a decade-old chassis tolerates cooling loop deterioration, oil seal degradation, or steering wear. Aligning your research with official FTC used car buyer guidance ensures you audit warranty status, review mandatory dealer disclosures, and corroborate multi-source records before making a financial commitment.
Consumer Survey Models Versus Warranty Claim Indexes
Questionnaire formats inherently introduce sampling bias. Demographics with higher disposable income frequently concentrate on distinct premium segments, leaving economy compacts or specialized utility vehicles with narrow statistical samples. Emotional sentiment also skews results; an owner investing significant capital into a high-end badge is far more likely to flag interior rattles than someone operating an everyday budget commuter.
Commercial repair telemetry removes this subjectivity. Service network invoicing verifies the broken component, the exact part code fitted, and the technician hours required to complete the repair. Balancing driver feedback against hard mechanical invoices reveals whether a model carries genuine design flaws or merely attracts dissatisfied reviewers.
Government Safety Defect Databases and Manufacturer Recalls
Public regulatory records expose failures that automakers rarely advertise. The National Highway Traffic Safety Administration logs formal consumer complaints, launches investigative proceedings, and enforces mandatory safety recalls for hazardous defects. These filings capture abrupt power losses, structural failures, and electrical thermal hazards.
Automakers also release internal Technical Service Bulletins directly to dealership service departments. These bulletins document diagnostic steps and updated component revisions for recurring production defects that fall outside mandatory safety interventions. A complete used car reliability report synthesizes both public regulatory filings and internal dealer service bulletins to identify unresolved mechanical liabilities.
Five-Step Framework to Audit a Target Model's Reliability Record
Systematic reliability auditing serves as your primary defense against inheriting someone else's expensive mechanical neglect. Color-coded chart ratings give you a starting point, but they won't confirm whether a specific vehicle sitting on a lot is mechanically sound. You need a repeatable evaluation sequence that moves methodically from broad database research down to physical component verification.
Executing a disciplined audit prevents emotional impulse buying. It establishes clear parameters for when to negotiate, when to request mechanical remediation, and when to walk away from a transaction entirely.
Step 1 to Step 3: Model Verification, Defect Filtering, and Cost Modeling
Start your research well before viewing a vehicle in person:
- Step 1: Isolate the build specifications. Identify the exact model year, engine code, and transmission type. Reliability profiles vary drastically within the same nameplate depending on whether it carries a base naturally aspirated engine or an optional turbocharged unit.
- Step 2: Aggregate defect records. Cross-examine repair frequency databases, government safety records, and technical service bulletins. Pinpoint which sub-assemblies consistently fail near your target vehicle's current odometer reading.
- Step 3: Model projected maintenance liabilities. Compare average unscheduled repair figures against your operating budget. Highly durable makes benchmark around $430 to $440 annually according to RepairPal data, while problem-prone alternatives easily exceed the $652 industry baseline.
To eliminate guesswork across competing models during these initial stages, compare detailed mechanical risk breakdowns through What Car Should I Buy? before spending hours traveling to physical dealerships.
Step 4 to Step 5: Service History Auditing and Diagnostic Scrutiny
Once you verify the model's macro-level reliability profile, transition directly to the physical asset.
Step 4 demands a forensic audit of the maintenance documentation. Verify that previous owners followed strict fluid change schedules rather than basic marketing intervals. Look for recorded campaign work addressing known factory technical bulletins, such as revised water pumps or updated transmission control software.
Step 5 requires direct electronic and mechanical interrogation. Plug an OBD-II diagnostic scanner into the vehicle's port and inspect the Inspection and Maintenance (I/M) readiness monitors. If the system displays monitors as "Not Ready," a seller may have cleared the diagnostic codes moments before your arrival to mask an active check engine light. Complete your assessment by checking physical component failure points identified in your preliminary used car reliability report, inspecting valve covers for weeping oil, checking coolant hoses for swelling, and listening for driveline whining under load.
Equip yourself with a structured Used Car Buying Checklist to execute this diagnostic verification systematically during your inspection.
Synthesizing Vehicle Data: Using Digital Tools to Eliminate Buyer Blind Spots
Manual vehicle research is slow and inherently fragmented. Sifting through government registries, consumer satisfaction reviews, and mechanic discussion boards rarely yields a unified verdict. Modern digital tools resolve this issue by consolidating disparate automotive databases into cohesive, structured profiles.
Algorithmic scoring eliminates subjective bias from the selection process. Instead of evaluating a car based on attractive aesthetics or showroom presentation, mathematical weighting balances repair frequencies, component failure severities, and anticipated maintenance liabilities. High-risk models drop to the bottom of the list automatically.
Head-to-Head Reliability and Running Cost Modeling
Vehicles in the exact same market class often exhibit drastically different long-term ownership costs. Two competing midsize SUVs may offer identical cargo volumes and fuel economy figures, yet one model might suffer twice the probability of transmission failure after 75,000 miles.
Direct side-by-side modeling exposes these financial liabilities before you buy. Factoring component longevity, depreciation trajectories, and historical repair costs into a structured Head-to-Head Car Comparison removes dealership sales hype. The outcome is pure financial clarity.
Empowering Buyers with Tailored Pre-Purchase Analysis
Standard data tables fail to account for unique driving requirements. A commuter driving 25,000 highway miles annually faces entirely different wear patterns than an urban driver accumulating 7,000 miles per year. Tailored digital research synthesizes broad dependability data into personalized rankings tailored to specific usage patterns.
Generating a structured assessment gives you immediate leverage before scheduling dealership visits. Rather than relying on an unweighted used car reliability report, shoppers can leverage What Car Should I Buy? to access objective digital analysis that synthesizes multi-source fault metrics into side-by-side model comparisons. Pairing that analytical foundation with a targeted Used Car Buying Checklist ensures you inspect the exact mechanical failure points unique to that vehicle's model year.
Transform Raw Reliability Data into Confident Buying Decisions
Evaluating a used vehicle doesn't have to be an expensive gamble. Relying on a single, unweighted used car reliability report often leaves you vulnerable to catastrophic powertrain failures disguised behind respectable brand badges. Real due diligence requires separating minor cosmetic rattles from high-risk mechanical defects, tracking model-year redesign cycles, and verifying physical component health with disciplined scrutiny.
Synthesizing multi-source reliability data eliminates single-outlet publication bias and exposes systemic component vulnerabilities before you test drive. Pairing component-level fault analysis with head-to-head comparison tools allows you to balance real-world running costs against your exact driving requirements. When you base your evaluation on empirical proof rather than dealership sales pitches, you take full control of the buying process. Take the guesswork out of your next vehicle search and generate your objective vehicle reliability analysis report to secure a dependable car with total confidence.
Frequently Asked Questions
What is the difference between vehicle dependability and initial quality?
Initial quality captures defects encountered during the first 90 days of ownership, whereas vehicle dependability tracks mechanical durability and component breakdown over several years. Initial surveys often reflect cosmetic alignment or user difficulty with digital controls. Dependability measurements capture true wear, fluid leaks, and powertrain integrity under continuous driving conditions. For used car shoppers, dependability data provides the only relevant indicator of ongoing mechanical longevity.
How do I find common mechanical faults for a specific used car model?
You find common mechanical faults by synthesizing technical service bulletins, federal defect complaints, and commercial workshop repair orders rather than relying on dealership marketing. Consult an objective used car reliability report that isolates specific engine and transmission combinations. Reviewing specialized owner forums and diagnostic trouble code trends also helps uncover recurring sub-assembly vulnerabilities, such as timing guide wear or differential leaks, before you inspect a vehicle.
Can a car brand with high reliability ratings produce an unreliable model?
Yes, highly ranked brands routinely build problem-prone vehicles when introducing unproven powertrains or rushed redesigns. Even automakers celebrated for durability occasionally release specific model years plagued by oil consumption, head gasket failure, or flawed transmission software. Brand reputations represent aggregated averages across entire product lines. They don't guarantee that every individual engine and chassis configuration within that lineup will perform reliably over time.
Why do reliability scores for the same vehicle differ across publications?
Scores differ because each automotive publication relies on distinct data gathering methodologies and mathematical weighting systems. Some outlets poll voluntary magazine subscribers who evaluate comfort and features subjectively. Others analyze raw problem counts per vehicle over a strict three-year period. When one platform counts infotainment bugs equally alongside catastrophic engine failures while another prioritizes mechanical severity, their published scores for the exact same vehicle naturally diverge.
Are minor electronic issues weighted the same as engine failures in reports?
It depends on the reporting methodology used by each publication. Certain benchmark studies record problems per vehicle equally, meaning an unresponsive touch screen carries the exact same mathematical penalty as a fractured piston. More rigorous consumer indices and multi-source analysis models apply algorithmic weighting to separate these concerns. That ensures minor connectivity glitches don't distort the true risk profile of a mechanically sound powertrain.
How do manufacturer technical service bulletins factor into reliability research?
Technical service bulletins provide direct documentation of recurring, factory-acknowledged engineering defects that don't meet the threshold for mandatory safety recalls. Automakers issue these detailed advisories specifically to assist dealership mechanics in diagnosing persistent component failures. Auditing these bulletins allows prospective buyers to identify known mechanical weak points and verify whether a previous owner had the updated replacement parts installed.
What constitutes an acceptable reliability rating when purchasing an older vehicle?
An acceptable rating for an older vehicle depends on component replacement severity rather than arbitrary numeric scores. A viable used car reliability report should show minimal risks of catastrophic engine, transmission, or hybrid battery failures, even if operational components like alternators or suspension bushings show expected wear. As long as unscheduled powertrain repairs remain statistically low, higher cosmetic or minor electrical fault rates are generally acceptable trade-offs.
